

Most districts don't have a staffing problem. They have a forecasting problem that only looks like a staffing problem when something breaks.
You can usually tell within about ten minutes of looking at a district's operations calendar. The attendance office is drowning in late August and running three people short every flu season. The enrollment team is staffed for a steady-state that doesn't exist, because 40% of their annual work lands in a six-week window. Finance is "fine" until a bond cycle, a grant close-out, and a payroll audit all land in the same month — and suddenly the one person who understands the fee-reconciliation logic is out on leave with no backup.
None of this is a mystery. The work is predictable. Transaction volume in school operations is some of the most seasonal, forecastable work you'll find anywhere. The reason districts get caught flat is that almost nobody translates that volume into a staffing model. They staff off last year's headcount, add a position when someone screams loud enough, and call it a plan.
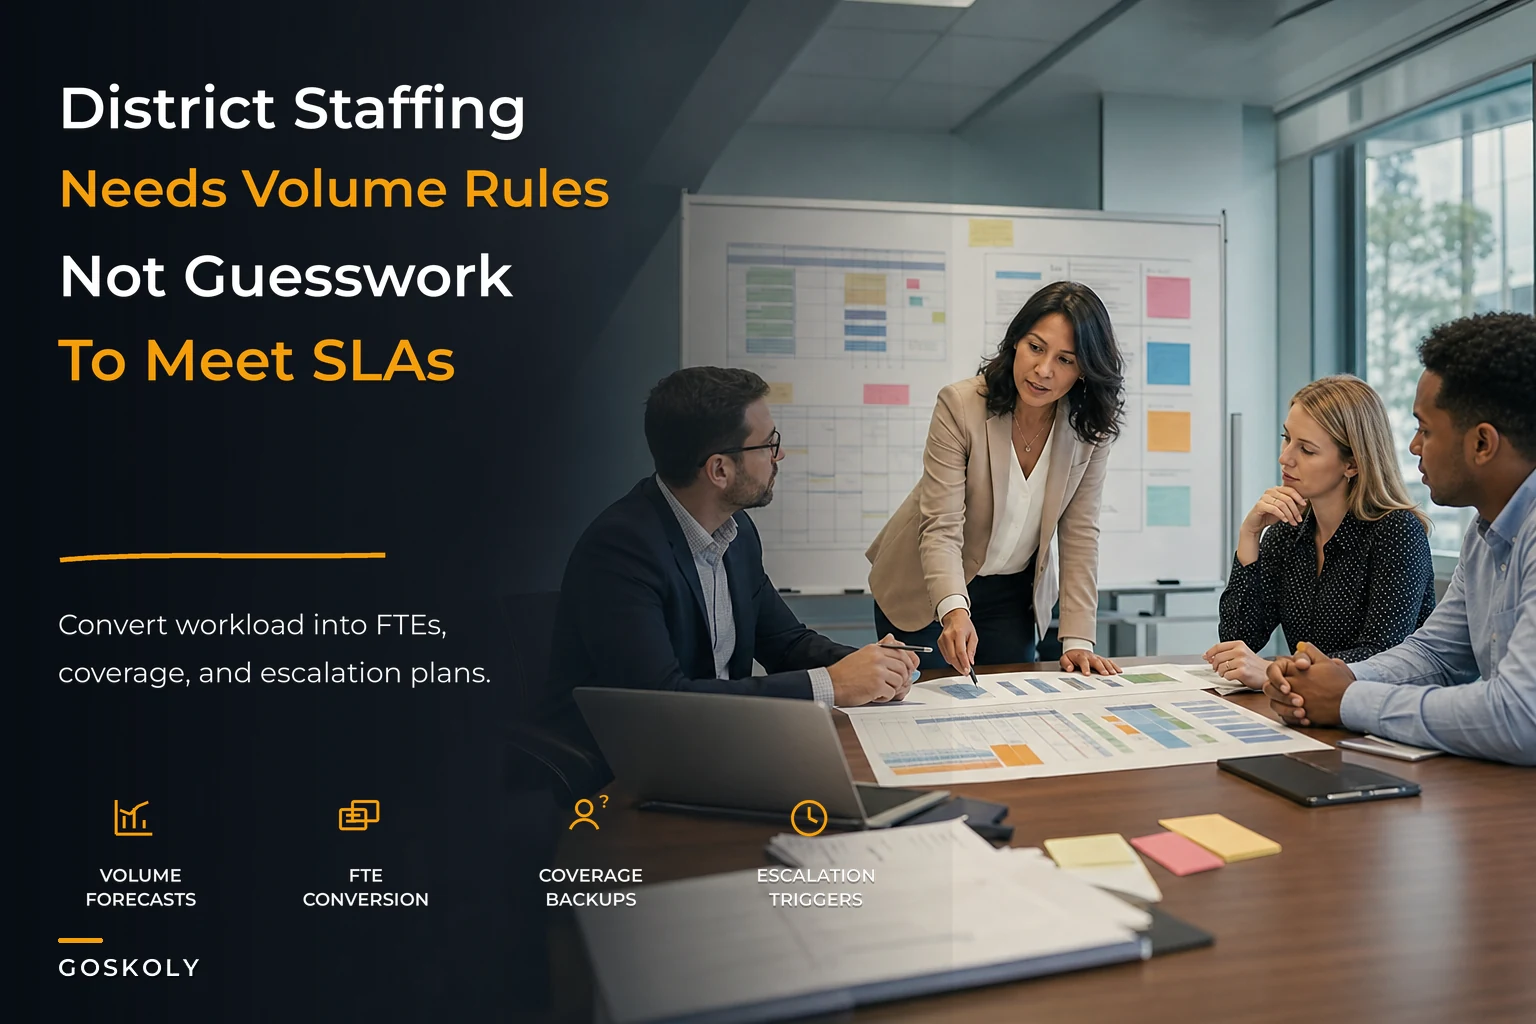
This article walks through how to build a staffing model that actually reflects the work — volume-to-FTE forecasting, coverage matrices, on-call and escalation tiers, and continuity plans that hold when someone leaves. The goal is a repeatable district workforce capacity planning approach you can rerun every year without starting from a blank page.
Why headcount-based staffing quietly fails
The default model in most districts is headcount inertia. You had four attendance clerks last year, you budget for four this year. The number survives because nobody's tying it to anything measurable.
The problem is that headcount hides load. Two attendance clerks processing 600 absence records a day during peak is a completely different operation than two clerks handling 180 a day in October. Same headcount, radically different risk. When you staff on headcount, you're not managing capacity — you're managing the memory of whoever set the number three years ago.
The pattern that keeps showing up: the work doesn't disappear when you're understaffed. It defers. Absence follow-ups pile up. Enrollment verifications sit in a queue. Finance reconciliations get pushed to "end of month," then end of quarter. The backlog becomes invisible because it's not a missing person — it's a growing pile of delayed transactions that nobody is counting. By the time it surfaces, it's a compliance issue or a parent complaint, not a staffing conversation.
What breaks at scale is coordination. A single school can run on informal coverage — everyone knows who covers the front desk when Maria's out. A district of 15 campuses can't. When you multiply informal coverage across dozens of sites, you get dozens of single points of failure, none of them documented, all of them invisible until they fail simultaneously during the first week of school.
Start with transaction volume, not positions
The foundation of any real capacity plan is counting the work. Not the people — the transactions. A transaction is any discrete unit of operational work that consumes staff time and recurs with some predictability.
Eliminate administrative overload.
GoSkoly helps you manage schedules, attendance, and communications seamlessly.
- Unified student and staff management
- Automated attendance tracking
- Integrated communication tools
No credit card required
For most districts, the high-volume operational domains are attendance, enrollment, and finance. Each has countable units:
-
Attendance daily absence records, follow-up contacts, truancy escalations, documentation requests
-
Enrollment new registrations, re-enrollments, record transfers, residency verifications, waitlist movements
-
Finance fee postings, meal-account adjustments, reconciliation exceptions, PO approvals, payroll corrections
The first exercise is pulling 12–18 months of actual volume for each of these, bucketed by week. You're looking for two things: the baseline (what a normal week looks like) and the peak (what the worst week looks like). The gap between those two numbers is your entire staffing challenge in one view.
A typical example: a mid-size district pulls enrollment transactions and finds a steady-state of roughly 90–120 registration actions per week most of the year. Then they look at late July through early September and the number jumps to somewhere around 700–900 per week. That's not a 20% bump you can absorb with overtime. That's a 7x surge that no permanent staffing level can sensibly cover — which tells you immediately that enrollment is a seasonal coverage problem, not a permanent-FTE problem.
That distinction matters enormously, and most districts miss it. They either overstaff year-round to survive six weeks, or they understaff and burn out their core team every August.
Turning volume into an FTE forecast
Once you have volume by week, the conversion to FTE is straightforward arithmetic — but the inputs are where the judgment lives.
You need three numbers per transaction type:
-
Average handle time — how long one transaction actually takes, including the parts people forget (the phone tag, the re-keying, the follow-up email).
-
Productive capacity per FTE — not 40 hours. After meetings, breaks, training, and the general friction of a workday, usable transaction time is closer to 28–32 hours a week for most operational roles.
-
Target service level — how fast the work needs to clear. A one-day SLA on absence follow-up needs more buffer capacity than a five-day SLA on a routine fee adjustment.
The basic formula:
> Required FTE = (Weekly transaction volume × average handle time) ÷ productive hours per FTE
Then you apply a buffer for service-level targets and variability. Work that has a tight SLA or spiky arrival pattern needs more buffer, because you can't average your way out of a Monday-morning spike with a Thursday lull.
| Input | Value |
|---|---|
| Peak weekly absence follow-ups | ~1,400 |
| Average handle time per follow-up | 6 minutes (0.1 hr) |
| Total weekly work hours | 140 |
| Productive hours per FTE | 30 |
| Base FTE required | ~4.7 |
| SLA buffer (tight same-day follow-up) | +15% |
| Peak FTE target | ~5.4 |
The useful insight here isn't the 5.4 number — it's the contrast with baseline. Run the same math on a normal 450-follow-up week and you land around 1.7 FTE. So this office has a permanent need of roughly 2 people and a surge need of 3 or more on top of that during peak weeks. That's a completely different conversation than "we need five attendance clerks." It tells you to staff the baseline permanently and solve the peak with floaters, cross-trained staff, or temporary coverage.
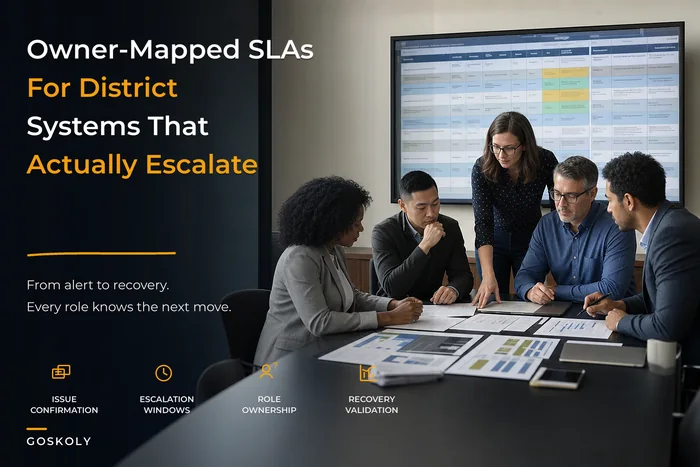
If you've already built out an owner-mapped SLA and cross-system responsibility matrix, your SLA targets and transaction ownership are already defined — which means the handle-time and service-level inputs for this forecast are half-done. The capacity plan is really just the staffing layer on top of the operating model you already have.
Coverage matrices: who does the work when someone's out
A forecast tells you how many people you need. A coverage matrix tells you what happens when one of them is gone — which, across a district, is always. Someone is always out.
The coverage matrix maps every critical function to a primary owner, a trained backup, and a fallback. The mistake most districts make is stopping at "backup" and assuming one layer is enough. One layer fails the moment the primary and the backup are out the same week — which happens more than you'd think during flu season or around holidays.
-
Primary — owns the work day-to-day
-
Secondary — fully cross-trained, can run it cold
-
Tertiary / escalation — a supervisor or cross-domain person who can keep things from collapsing even if they're slower
The second mistake is treating cross-training as a checkbox. "Sarah is trained on enrollment" means nothing if Sarah last touched the enrollment queue 14 months ago and the system has changed twice since. Cross-training has a half-life. If your backups aren't rotating through the actual work a few times a year, they're backups on paper only.
Rotate backups through the actual work at least once every 90 days to keep cross-training current.
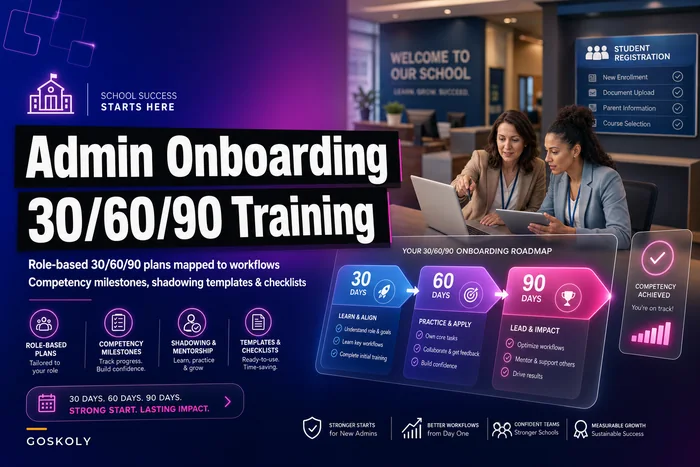
A practical rule that holds up: every critical function should have at least one backup who has done the real work within the last 90 days. If your matrix can't honestly claim that, you don't have coverage — you have hope. Tying backup rotation into your role-based 30/60/90 onboarding and competency milestones is the cleanest way to keep cross-training current instead of letting it decay quietly over a year.
On-call and escalation models
Most district operations don't need a 24/7 on-call rotation. But they absolutely need a defined escalation path, because the real failure mode isn't the absence of a plan — it's the ambiguity of who decides what, when the normal owner is unavailable and the clock is running.
Tier 1 — Normal operations. Work flows to the primary owner within SLA. No escalation needed. The vast majority of transactions live here.
Tier 2 — SLA at risk. A queue is backing up, a backlog is forming, or the primary is out and the secondary is slammed. This triggers a supervisor who can reprioritize, pull a floater, or temporarily relax a non-critical deadline.
Tier 3 — Operational incident. Something is actively breaking against a hard deadline — a state submission, a payroll run, a first-day-of-school enrollment crush. This pulls in a cross-domain decision-maker with authority to shift resources across teams.
The key design decision is defining the trigger, not just the tier. "Escalate when it's bad" is useless. "Escalate when the absence follow-up queue exceeds 200 unprocessed records or ages past 24 hours" is something a clerk can actually act on at 9 a.m. without waiting for permission.
Worth internalizing: good escalation models move the decision up without moving all the work up. A supervisor's job in Tier 2 isn't to process 300 records themselves — it's to decide where the next three hours of available capacity go. When districts conflate those two things, supervisors become bottlenecks and the escalation path makes things slower instead of faster.
Continuity and succession: planning for the person who leaves
Coverage handles the person who's out for a week. Continuity handles the person who's gone for good — and this is where most districts are genuinely exposed.
In almost every district, there's at least one person who holds operational knowledge that lives nowhere else. The clerk who knows which fee codes map to which programs. The registrar who understands the twelve edge cases in residency verification. The finance person who built the reconciliation logic in their head and never wrote it down. When that person retires or leaves, the work doesn't just slow — it becomes genuinely unrecoverable for a stretch.
Succession planning in operations isn't an org chart exercise. It's a knowledge-capture exercise. The question isn't "who gets promoted" — it's "if this person vanished tomorrow, could someone else run their function from documentation alone?"
A continuity template for each critical role should capture:
-
The recurring transactions and their cadence
-
The non-obvious rules and exceptions (the stuff that lives in someone's head)
-
System access and where credentials are managed
-
The hand-off points to other teams
-
The known failure modes and how they're handled
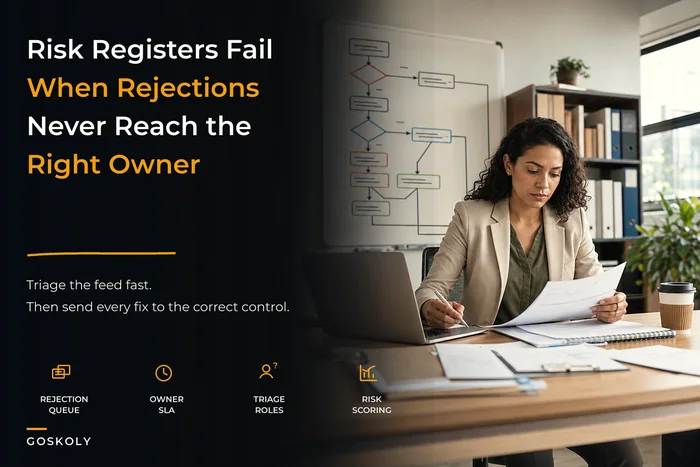
This maps directly to risk. Any function where the honest answer to "could someone else run this cold?" is no belongs on your risk register as a single point of failure — the same way you'd track any other operational exposure in an operational risk framework with prioritized registers and controls. Succession gaps aren't an HR footnote; they're an operational risk with a real probability and a real impact.
A repeatable annual process
The whole point of this is that you run it once and rerun it every year, not rebuild it from scratch. The yearly cycle:
-
Pull 12–18 months of transaction volume across attendance, enrollment, and finance, bucketed by week.
-
Identify baseline vs. peak for each domain. Decide which problems are permanent-FTE and which are seasonal-surge.
-
Convert volume to FTE using handle time, productive hours, and SLA buffers. Separate your core staffing from your surge staffing.
-
Build the coverage matrix — primary, secondary, tertiary for every critical function, with a hard rule on backup recency.
-
Define escalation tiers and triggers in numbers a frontline person can act on.
-
Write continuity templates for any role that holds undocumented knowledge, and flag single points of failure.
-
Review quarterly, re-forecast annually. Volume shifts. Staff turn over. The model has to breathe.
A quick visual of the annual cycle can make it easier to share with leadership and link to your review calendar.
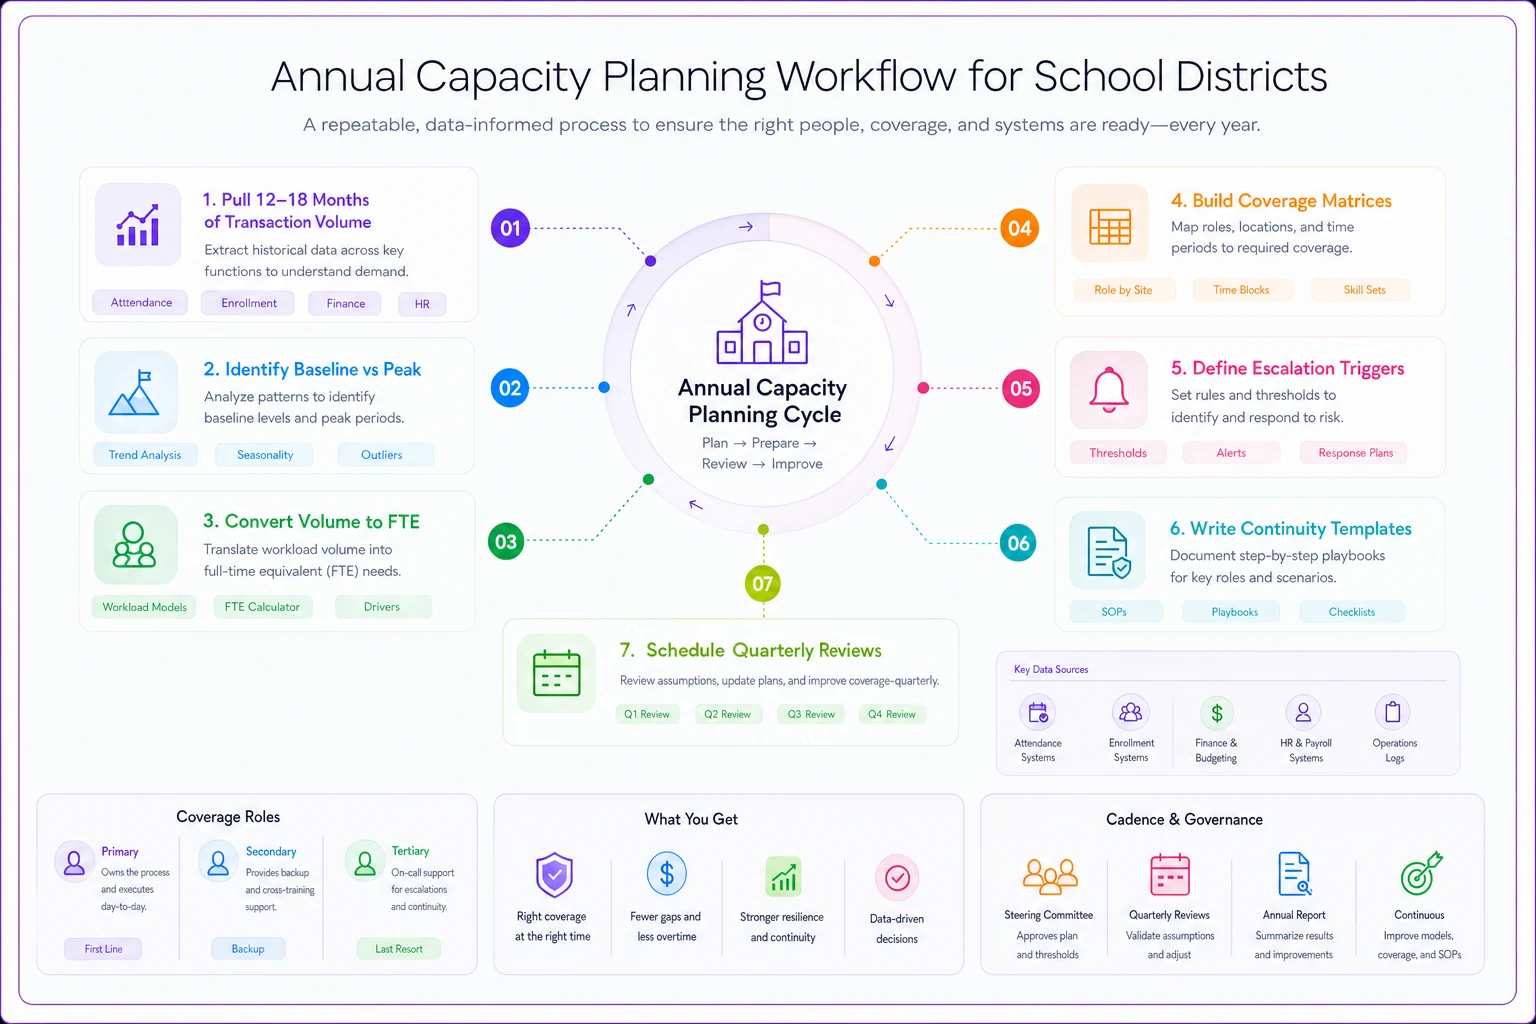
Keep the cycle on a calendar you review quarterly so the model stays current.
A real scenario
A district of roughly 9,000 students kept hitting the same wall every enrollment season. Their registration team of four was fine for about nine months of the year and completely underwater for the other three. Each August, SLA on enrollment processing stretched from a target of two days to something closer to nine, parent complaints spiked, and two of the four clerks were effectively doing mandatory overtime for six straight weeks.
The leadership instinct was to add a fifth permanent position — roughly $55k–$62k a year loaded. But when they actually pulled the weekly volume, the picture was obvious: baseline work needed about 2.5 FTE, and peak needed closer to 6. A fifth permanent hire would have been overstaffed for most of the year and still short during peak.
What they did instead: held the core team, cross-trained two people from the attendance office (whose peak lands in a different part of the calendar), and brought on temporary coverage for the six-week surge. The next enrollment season, SLA stayed inside four days at the worst point, the overtime bill dropped noticeably, and they avoided a permanent salary line they didn't need. The fix wasn't more people — it was matching the shape of the staffing to the shape of the work.
When this level of planning is worth it — and when it isn't
This isn't free. Building a real capacity model takes time, and for a very small district, the formality can outweigh the benefit.
When it makes sense:
-
You run multiple campuses and informal coverage keeps failing
-
You have clear seasonal surges that overtime can't absorb
-
You've been burned by a key person leaving with knowledge in their head
-
You're being asked to justify staffing to a board or budget committee
When it's overkill:
-
A single small school where everyone genuinely knows every function
-
Operations stable enough that last year's headcount actually still fits
-
You don't yet have the transaction data to forecast from — fix the counting first
Who should be careful: districts tempted to use this model to justify cuts. The math cuts both ways. If you build an honest forecast and it says you're understaffed at peak, the answer is surge coverage or process change — not pretending the peak doesn't exist. A capacity model used to rationalize chronic understaffing just gives the backlog a more sophisticated excuse.
The thing most plans miss
The districts that handle staffing well aren't the ones with the most people. They're the ones who've stopped treating staffing as a headcount number and started treating it as a function of countable work. Once you can see the work by week, almost everything else — how many people, who covers whom, when to escalate, what happens when someone leaves — becomes a question with an actual answer instead of a guess that surfaces as a crisis every August.
Start by counting the transactions. The rest of the model builds on that foundation, and more importantly, it keeps building year after year instead of resetting every time someone new inherits the schedule.
Start by counting the transactions. The rest of the model builds on that foundation, and more importantly, it keeps building year after year instead of resetting every time someone new inherits the schedule.
Ready to optimize your school operations?
Join hundreds of schools using GoSkoly to save time, improve collaboration, and enhance student outcomes.