
State reporting windows create operational chaos in school districts twice a year. October submissions, March corrections, end-of-year reconciliations—each deadline brings the same scramble to transform messy operational data into pristine state formats. Districts are typically juggling somewhere between 8 and 15 different software systems that store student information in completely different ways, then somehow need to produce unified reports that pass state validation checks.
The problem isn't just technical complexity. It's the operational burden when your attendance system stores student IDs as 9-digit numbers while your gradebook uses state-assigned 10-digit codes. Or when special education records live in three different platforms, each tracking the same services using different terminology. These mismatches compound into submission errors that trigger compliance warnings, funding delays, and frantic last-minute corrections.
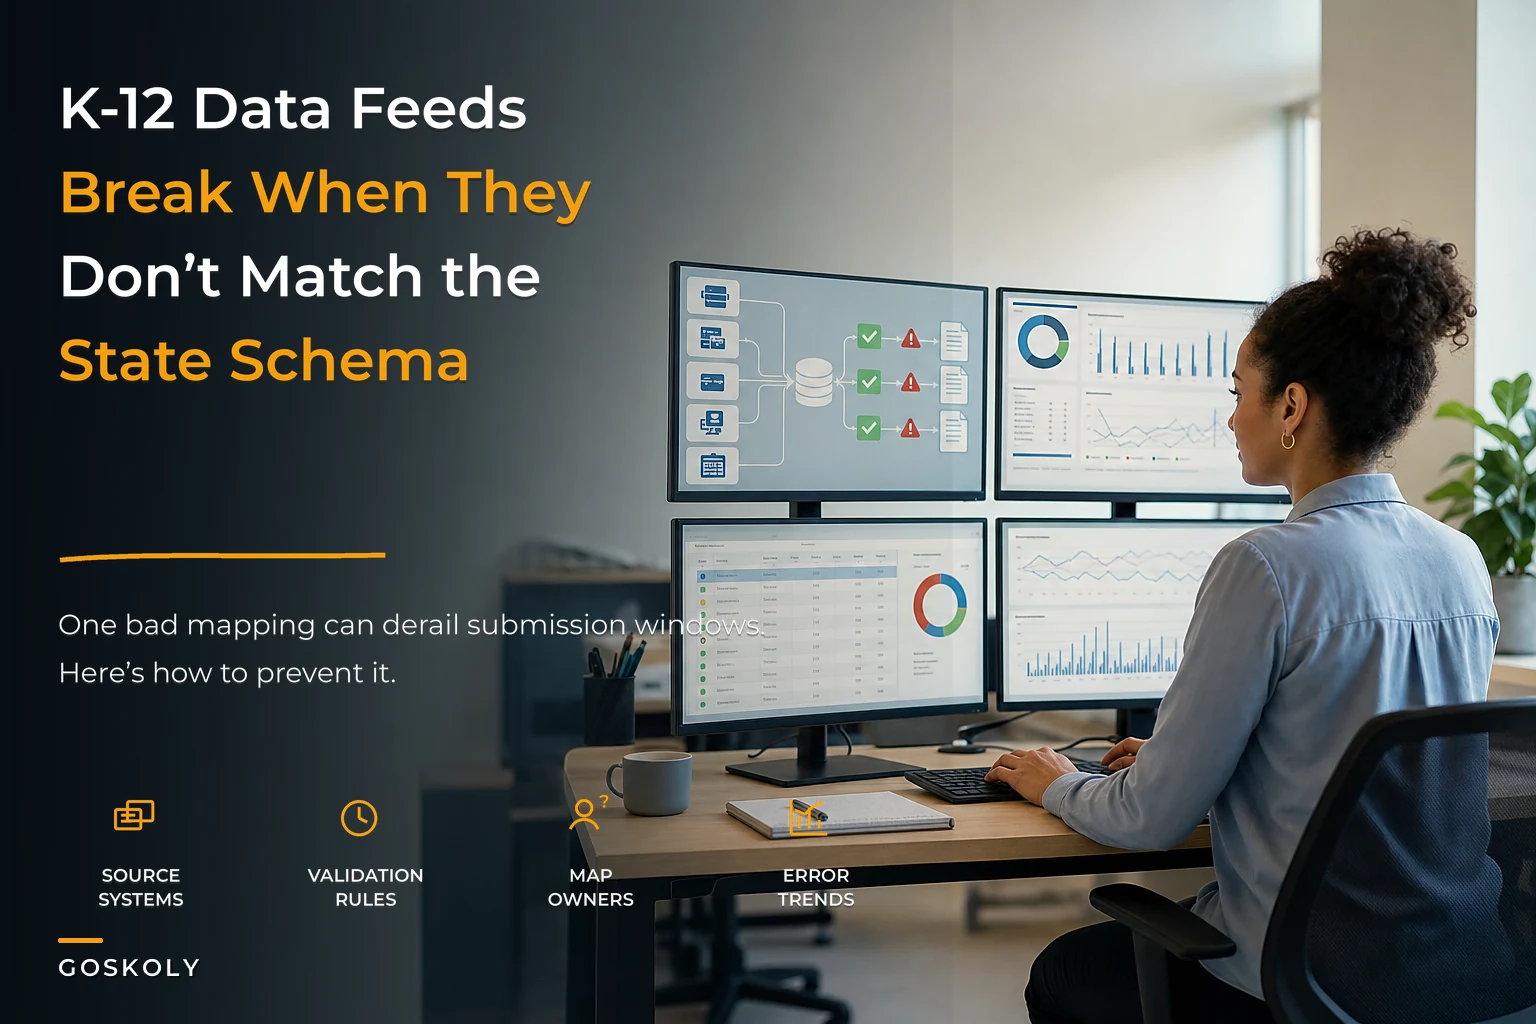
Why K-12 data interoperability breaks during state reporting season
School districts operate like small cities with dozens of specialized departments, each maintaining their own records. Transportation tracks bus routes and pickup times. Health services monitors immunizations. Special education maintains IEP documentation. Academic departments manage grades and assessments. Food services tracks meal eligibility. Each system evolved independently, creating a data landscape that looks more like archaeological layers than integrated infrastructure.
State education agencies want unified reporting across all these domains. A single student enrollment report pulls from registration systems, attendance platforms, demographic databases, program eligibility trackers, and assessment repositories. The state wants everything formatted according to their specific schemas—field lengths, code values, date formats, required relationships between data elements.
Between your operational systems and state requirements sits the translation layer that makes or breaks your submission. Most districts handle this through manual exports, Excel manipulations, and custom scripts written by whoever had time during the last reporting crisis. These ad-hoc solutions work until they don't—and you usually discover the failure after receiving rejection notices from the state portal.
The operational cost goes beyond IT hours. Teachers and administrators spend days verifying data accuracy instead of focusing on instruction. Errors in state submissions affect funding calculations, accountability ratings, and compliance standings. A missed special education service code might trigger an audit. Incorrect enrollment counts affect budget allocations for the following year.
The canonical schema approach: Building a stable middle layer
Instead of managing dozens of point-to-point connections between systems, effective K-12 data interoperability for state reporting requires a canonical data model—a standardized intermediate format that captures all essential school data elements. Think of it as your district's Rosetta Stone, translating between the languages of different systems while maintaining semantic meaning.
Eliminate administrative overload.
GoSkoly helps you manage schedules, attendance, and communications seamlessly.
- Unified student and staff management
- Automated attendance tracking
- Integrated communication tools
No credit card required
A canonical schema for student enrollment might look like this:
| Data Element | Canonical Format | Source Systems | State Mapping |
|---|---|---|---|
| Student ID | 10-digit state format | SIS (local ID), Transport (route ID), Lunch (account #) | Direct pass-through |
| Enrollment Status | Active/Inactive/Withdrawn | SIS (multiple statuses), Attendance (present/absent patterns) | Map to state codes 01-15 |
| Grade Level | K-12 + Pre-K + Adult | SIS (grade codes), Academic (course levels) | Convert to state grade codes |
| Program Participation | Standardized program codes | SpEd system, Title I tracker, ELL database | Aggregate and deduplicate |
| Entry/Exit Dates | YYYY-MM-DD | Registration, Attendance, Withdrawal forms | Validate date ranges |
This middle layer absorbs the complexity of system variations. When the attendance system updates their database schema, you modify one mapping instead of rewriting every state report. When the state changes submission requirements, you adjust the output transformation without touching source system integrations.
The canonical model also enables data quality rules that catch problems before they reach state validation. If a student appears enrolled in two schools simultaneously, the canonical layer flags the conflict. If special education services lack required authorization codes, validation rules trigger alerts. These checks happen continuously, not just during reporting windows.
Here's a simple workflow visualization of how source systems feed a canonical schema and produce state-ready outputs.
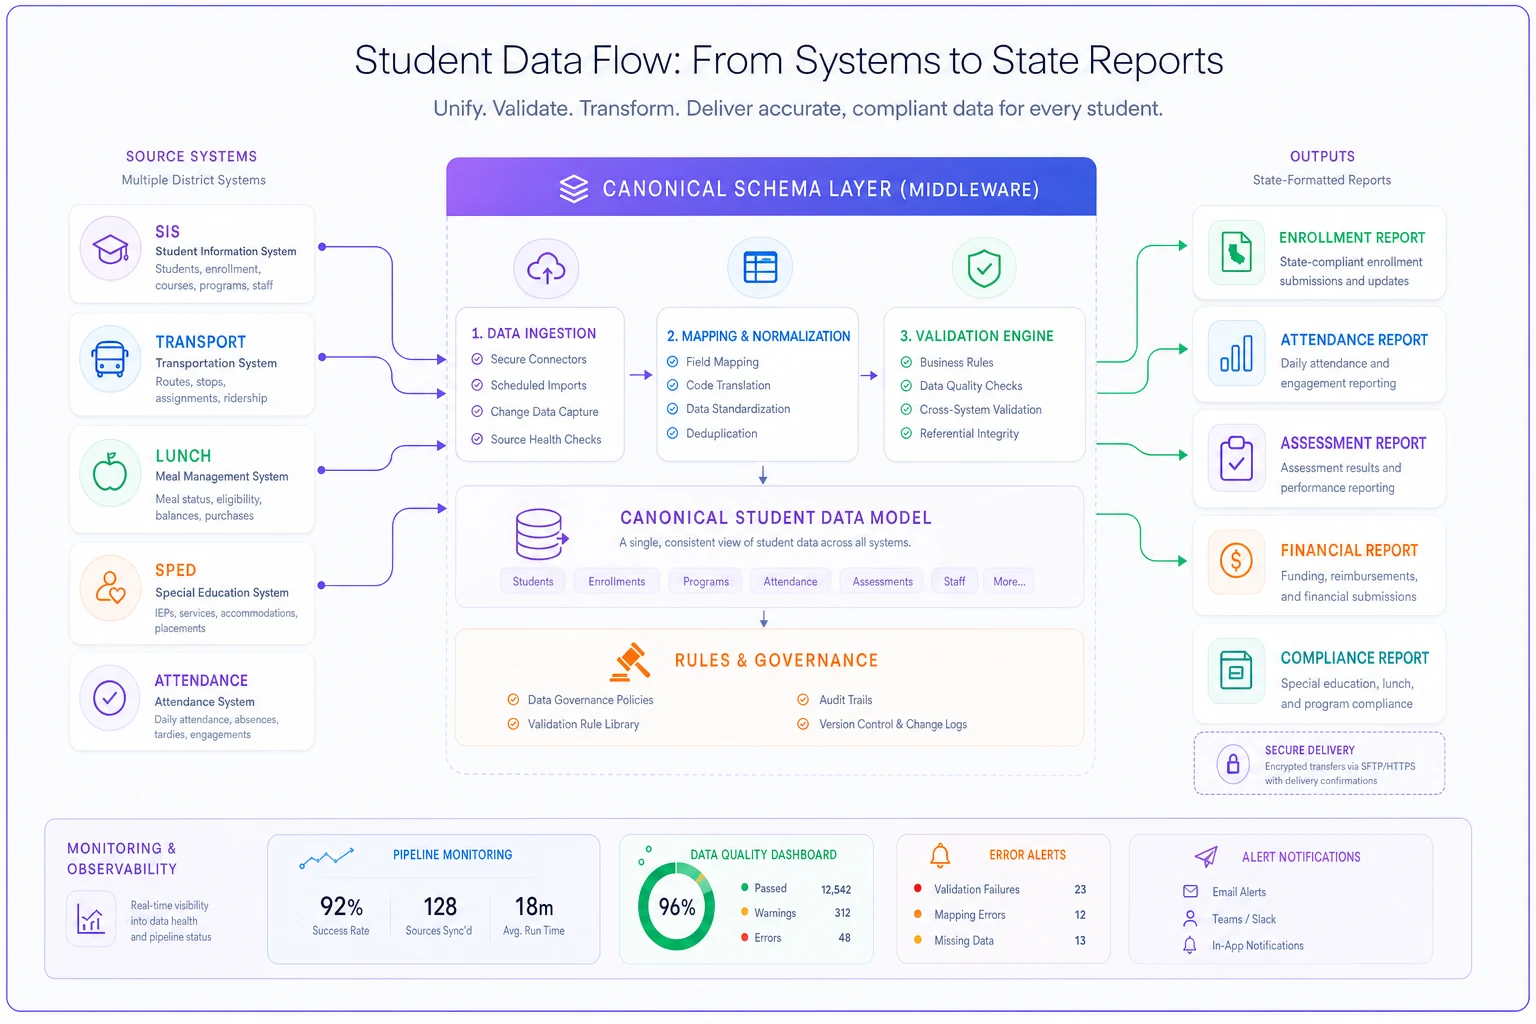
The graphic highlights continuous validation and a single mapping layer that minimizes direct connections.
Mapping templates that handle real district complexity
Generic data mapping assumes clean, consistent source data. School systems rarely deliver that. Your mapping templates need to handle the messiness of real educational operations—incomplete records, conflicting information, historical anomalies, and edge cases that come from serving diverse student populations.
Operational Reality:
-
Morning absence recorded in main SIS
-
Afternoon early release noted in nurse's system
-
Field trip attendance tracked in permission slip database
-
In-school suspension logged in discipline platform
State Requirement:
-
Single daily attendance code per student
-
Specific absence reason categories
-
Minute thresholds for partial day calculations
Your mapping template needs business logic to reconcile these sources:
IF nursecheckouttime < 11:30 AND noreturnflag = TRUE THEN attendancecode = "Half Day Absence - Medical" ELSE IF disciplinerecord EXISTS FOR date AND disciplinetype = "ISS" THEN attendancecode = "Present - Restricted" ELSE IF fieldtriproster CONTAINS studentid THEN attendancecode = "Present - School Activity"
These templates become operational documentation. New staff can understand how attendance calculations work without reverse-engineering database queries. When state auditors question specific attendance codes, you point to the documented mapping logic instead of digging through old emails trying to reconstruct the methodology.
Reconciliation testing against state validation rules
State education portals reject submissions for hundreds of different validation errors. Missing required fields, invalid code combinations, logical inconsistencies, date range violations—each error requires investigation, correction, and resubmission. Smart districts build reconciliation processes that catch these issues before submission.
Start with the state's published validation rules, typically available as technical documentation or embedded in their data dictionary. Transform these rules into automated test cases that run against your canonical data:
Test Case: Special Education Service Validation
-
Required
Every student with disability code must have active IEP
-
Validation
IEP start date <= current date <= IEP end date
-
Cross-check
Service minutes must match IEP documentation
-
Frequency
Daily during school year, weekly during summer
Test Case: Enrollment Continuity
-
Required
No gaps in enrollment for students not formally withdrawn
-
Validation
Entry date through exit date or current
-
Cross-check
Attendance records must exist for enrolled periods
-
Frequency
Weekly, with deep scan before each submission
Build test suites that mirror state validation sequences. If the state checks enrollment before validating program participation, your tests should follow the same order. This prevents cascading errors where fixing one issue reveals another that was previously hidden.
Document failure patterns from previous submissions. That cryptic "Error 447: Invalid program combination" might mean a student can't be simultaneously enrolled in two mutually exclusive programs—knowledge gained through painful trial and error that needs to live in your test suite, not someone's memory.
Monitoring dashboards aligned to reporting windows
Districts need different operational views as reporting deadlines approach. Six weeks before submission, you're monitoring data completeness. Two weeks out, you're tracking validation errors. During the submission window, you're watching for processing confirmations and acceptance notices.
An effective monitoring dashboard for K-12 data interoperability state reporting shows:
Data Completeness Metrics:
-
Percentage of students with complete demographic data
-
Special programs with missing authorization documents
-
Teachers without proper certification codes
-
Courses lacking state curriculum alignments
Validation Status Tracking:
-
Count of records passing/failing each validation rule
-
Trending of error rates over time
-
Comparison to previous year's submission quality
-
Heat map of problematic data categories
Operational Health Indicators:
-
Last successful sync from each source system
-
Data freshness by domain (attendance, grades, discipline)
-
Pipeline processing times and bottlenecks
-
Failed transformation or mapping errors
Configure dashboard alerts to escalate only when validation error rates exceed agreed thresholds to avoid alert fatigue.
Structure dashboard access by responsibility. Principals see their school's data quality scores. District administrators view aggregate compliance metrics. IT staff monitor technical pipeline health. State reporting coordinators track submission readiness across all domains.
During the October enrollment count, your dashboard might show that 94% of students have complete records, but 127 special education students lack required service codes. The heat map reveals these students cluster in three schools, pointing toward a training issue with those coordinators. That kind of targeted insight means focused remediation instead of a district-wide fire drill.
When canonical approaches actually improve district operations
Not every district needs elaborate data interoperability infrastructure. Small districts with around 500 students might manage fine with carefully maintained spreadsheets. Districts running integrated platforms from a single vendor might have built-in state reporting modules that work adequately.
Canonical schemas and automated pipelines make sense when:
-
You're managing 5,000+ students across multiple schools
-
Source systems come from different vendors with incompatible data models
-
State reporting consistently requires last-minute scrambles
-
Data quality issues regularly cause submission rejections
-
Multiple staff members spend days on manual data preparation
-
Compliance audits frequently identify data discrepancies
The investment in proper data governance infrastructure pays off through reduced staff overtime during reporting periods, fewer compliance violations, and more accurate funding calculations.
The cascade effect of poor data interoperability
When data interoperability fails, the damage spreads beyond missed deadlines. The operational impact tends to surprise even experienced administrators.
One large suburban district discovered their enrollment counts were off by 200 students due to mapping errors between their registration and attendance systems. The state funding adjustment meant $1.4 million less in the following year's budget. But the immediate impact was actually worse—they had to freeze hiring, delay textbook orders, and cancel professional development programs while appealing the count.
Another district's special education reporting errors triggered a federal compliance review. Beyond the audit burden itself, teachers had to recreate service documentation for hundreds of students. Speech therapists, occupational therapists, and special education teachers spent weeks rebuilding records instead of serving students. Parent complaints spiked as services got delayed during the documentation scramble.
These failures often stem from treating state reporting as an IT problem rather than an operational one. The technology team can build perfect pipelines, but if school secretaries enter enrollment dates incorrectly, or if special education coordinators use the wrong service codes, or if teachers forget to submit grade changes, technical infrastructure can't compensate for operational breakdowns.
Building sustainable data operations beyond compliance
Districts that handle state reporting smoothly treat data interoperability as part of standard operations, not a special project that activates before deadlines. They embed data quality into daily workflows. They train staff on the downstream impact of data entry decisions. They maintain documentation that survives staff turnover.
One district created "data steward" roles at each school—typically an assistant principal or experienced secretary who understood both operational workflows and reporting requirements. These stewards ran weekly data quality reports, coached staff on proper data entry, and served as the first line of defense against submission errors. The district's state reporting error rate dropped from around 12% to under 2% within a single academic year.
Another approach involves graduated validation throughout the school year. Instead of discovering problems during submission windows, run monthly "pre-flight checks" that simulate state validation rules. September's check might focus on enrollment and demographic data. October adds attendance patterns. November validates special program participation. By the time actual submission arrives, most issues have already been identified and resolved.
The operational shift happens when clean data becomes an expectation rather than an aspiration. Teachers understand that entering grades promptly affects funding calculations. Attendance clerks recognize that coding absences correctly impacts accountability ratings. The entire organization aligns around data quality because everyone understands the downstream consequences.
Automated pipelines that reduce manual reconciliation
Modern school operations generate too much data for manual processing. A mid-sized district might process 50,000 attendance records daily, 10,000 grade updates per marking period, and thousands of discipline incidents, health records, and program changes every month. Manual reconciliation at that scale guarantees errors and overwhelmed staff.
AI-powered operational platforms can fundamentally change how districts handle data interoperability. Instead of IT staff writing custom scripts for each data transformation, intelligent mapping engines learn the relationships between your source systems and state requirements. These platforms identify patterns in your data, suggest mapping rules, and flag anomalies that might indicate problems.
The automation extends beyond simple field mapping. AI-assisted tools can detect when a student's enrollment status conflicts across systems, reconcile the discrepancy based on historical patterns and business rules, then flag edge cases for human review. They can identify data quality trends, predict which records might fail state validation, and suggest corrections based on similar cases from previous submissions.
For performance analytics and reporting, automated pipelines ensure your dashboards reflect current operational reality rather than last week's exported spreadsheet. Real-time data synchronization means principals see attendance patterns as they develop, not after the reporting period ends.
The technical architecture that supports long-term success
Building K-12 data interoperability for state reporting requires more than connecting systems—it demands an architecture that evolves with changing requirements while maintaining operational stability. The canonical schema serves as your north star, but implementation details determine whether your solution survives the next state mandate change or vendor upgrade.
Start with source system integration patterns that minimize disruption. Rather than direct database connections that break when schemas change, use API integrations where available or file-based exchanges with defined formats. Build retry logic for failed connections. Queue messages during system maintenance windows. Log every transaction for troubleshooting when reconciliation reveals discrepancies.
Your transformation layer needs versioning and rollback capabilities. When the state changes their ethnic category codes, you should be able to update mappings without losing historical reporting capability. When you discover a mapping error from three months ago, you need to regenerate affected reports without corrupting current data.
The validation framework should separate technical checks from business rule validation. Technical validations ensure data types match, required fields exist, and referential integrity holds. Business validations confirm that a student's age matches their grade level, that program participation dates align with eligibility periods, and that funding categories don't conflict.
Monitoring and alerting require careful calibration. Alert fatigue from excessive warnings leads to ignored critical issues. Focus alerts on actionable problems—source systems that stop sending data, validation error rates exceeding thresholds, processing pipelines falling behind schedule. Everything else goes to dashboards for regular review rather than immediate notification.
Moving from reactive scrambles to proactive operations
Districts that are successfully managing K-12 data interoperability for state reporting share a few common characteristics. They've stopped treating each submission as a crisis requiring heroic effort and started handling reporting as routine workflow.
These districts invest in training that connects daily operations to reporting outcomes. The attendance secretary understands how their coding decisions affect state compliance. The special education coordinator knows which data elements trigger funding calculations. The registrar recognizes how enrollment timing impacts accountability metrics.
They maintain living documentation rather than outdated binders. Mapping specifications, validation rules, and troubleshooting guides exist in shared platforms where staff can access current information. When the state updates requirements, documentation updates flow through the same change management process as system modifications.
Most importantly, they've stopped viewing state reporting as a burden imposed by bureaucrats and started recognizing it as operational intelligence gathering. The same data pipelines that feed state submissions can identify students at risk of dropping out, reveal resource allocation imbalances, and highlight programs delivering strong results.
The path to operational maturity
K-12 data interoperability for state reporting will always involve complexity—educational operations are inherently complex, serving diverse populations with varied needs through multiple programs and funding sources. But complexity doesn't have to mean chaos.
The canonical schema approach, combined with solid mapping templates, comprehensive testing, and aligned monitoring, transforms state reporting from a scramble into a predictable process. Districts that invest in this operational infrastructure see benefits beyond compliance: better decision-making from reliable data, reduced staff burnout from eliminated fire drills, and more time focused on students rather than spreadsheets.
The technology exists to automate much of this burden. AI-powered platforms can handle routine mapping and validation, freeing your team to address the exceptions and edge cases that actually require human judgment. But technology alone won't solve it. Success requires aligning people, processes, and systems around operational data quality.
Start with one reporting cycle. Document your current pain points. Build canonical schemas for your most problematic data domains. Create mapping templates that handle your specific operational reality. Implement testing that catches issues before the state does. Develop dashboards that give everyone visibility into data quality.
Then iterate. Each reporting cycle, expand your canonical model. Refine mapping logic based on actual errors. Add test cases for newly discovered edge cases. Enhance monitoring to catch emerging patterns. Within a few cycles, state reporting stops being your most stressful operational challenge and starts looking a lot more like a demonstration of district operational maturity.
K-12 data interoperability for state reporting will always involve complexity—educational operations are inherently complex, serving diverse populations with varied needs through multiple programs and funding sources. But complexity doesn't have to mean chaos.
The canonical schema approach, combined with solid mapping templates, comprehensive testing, and aligned monitoring, transforms state reporting from a scramble into a predictable process. Districts that invest in this operational infrastructure see benefits beyond compliance: better decision-making from reliable data, reduced staff burnout from eliminated fire drills, and more time focused on students rather than spreadsheets.
Ready to optimize your school operations?
Join hundreds of schools using GoSkoly to save time, improve collaboration, and enhance student outcomes.